| Date | Stock_A_Price | Stock_B_Price | Log_Spread | Z_Score | |
|---|---|---|---|---|---|
| 0 | 2025-04-03 | 3826.15 | 1441.89 | 0.975904 | -1.303938 |
| 1 | 2025-04-04 | 3653.24 | 1389.87 | 0.966404 | -2.000556 |
| 2 | 2025-04-07 | 3478.38 | 1333.84 | 0.958505 | -2.383379 |
| 3 | 2025-04-08 | 3499.08 | 1315.20 | 0.978511 | -0.501904 |
| 4 | 2025-04-09 | 3575.12 | 1348.45 | 0.975043 | -0.737020 |
| 5 | 2025-04-10 | 3615.24 | 1373.36 | 0.967898 | -1.451872 |
| 6 | 2025-04-11 | 3659.60 | 1389.79 | 0.968201 | -1.270189 |
| 7 | 2025-04-14 | 3680.78 | 1414.20 | 0.956561 | -2.100495 |
| 8 | 2025-04-15 | 3631.17 | 1397.93 | 0.954562 | -1.980073 |
| 9 | 2025-04-16 | 3566.86 | 1364.36 | 0.961000 | -1.252244 |
| 10 | 2025-04-17 | 3603.47 | 1390.90 | 0.951946 | -1.765290 |
| 11 | 2025-04-21 | 3569.24 | 1368.50 | 0.958637 | -1.116397 |
| 12 | 2025-04-22 | 3678.66 | 1393.54 | 0.970701 | -0.058849 |
| 13 | 2025-04-23 | 3652.11 | 1380.50 | 0.972859 | 0.169770 |
| 14 | 2025-04-24 | 3609.65 | 1352.17 | 0.981900 | 0.953797 |
| 15 | 2025-04-25 | 3609.33 | 1347.00 | 0.985642 | 1.328003 |
| 16 | 2025-04-28 | 3617.91 | 1370.16 | 0.970969 | 0.078787 |
| 17 | 2025-04-29 | 3704.95 | 1399.23 | 0.973748 | 0.368853 |
| 18 | 2025-04-30 | 3762.60 | 1415.20 | 0.977839 | 0.772011 |
| 19 | 2025-05-01 | 3732.92 | 1407.68 | 0.975248 | 0.645104 |
Pairs Trading Analysis: AZO vs ORLY
Stock A: AZO | Stock B: ORLY
AZO (AutoZone Inc) is a leading retailer in the automotive aftermarket that specializes in replacement parts, accessories, and maintenance products for vehicles.
ORLY (O’Reilly Automotive Inc) is a major distributor of automotive replacement parts, tools, supplies, and equipment, serving both professional service providers and retail customers.
These two companies operate in the same industry sector, have similar business models, and are affected by similar economic factors, making them good candidates for a pairs trading strategy.
How Pairs Trading Works
The core concept behind pairs trading is mean reversion. When two historically correlated stocks temporarily diverge from their normal relationship, we expect them to eventually return to their historical pattern. The strategy is implemented as follows:
- Identify pairs of stocks that historically move together
- Monitor the spread between the prices of the two stocks
- Calculate the Z-score to identify when the spread deviates significantly from its historical mean
- Enter a trade when the Z-score exceeds a threshold (indicating the spread is abnormally wide)
- Exit the trade when the spread returns to normal levels
In our AZO-ORLY pairs trading strategy, we’ll: - Go long AZO and short ORLY when the Z-score is significantly negative (AZO is undervalued relative to ORLY) - Go short AZO and long ORLY when the Z-score is significantly positive (AZO is overvalued relative to ORLY)
Important Values
Stock prices are all from Shinybroker. Thanks Professor Jacob :)
Understanding the Key Metrics
The table above shows the most recent 20 days of data for our pair. Here’s what each column represents:
- Date: Trading day
- Stock_A_Price: Closing price of AutoZone (AZO)
- Stock_B_Price: Closing price of O’Reilly Automotive (ORLY)
- Log_Spread: The natural logarithm of the price ratio (ln(AZO/ORLY)), which helps normalize the price difference
- Z_Score: The number of standard deviations the log spread is away from its 20-day moving average
The Z-Score is our primary trading signal. When it exceeds our thresholds (typically ±2.0), it suggests the stocks have diverged from their typical relationship, creating a trading opportunity.
Statistical Analysis
Correlation Analysis:
Pearson correlation coefficient: 0.9559
Conclusion: Strong correlation (≥0.7), suitable for pairs trading

Cointegration Test:
p-value: 0.0851
Conclusion: Pair is not cointegrated (p-value >= 0.05)

Augmented Dickey-Fuller Test:
ADF Statistic: -2.5633
p-value: 0.1008
Conclusion: Spread is not stationary (p-value >= 0.05)

AZO and ORLY are somewhat suitable for pairs trading, meeting most test conditions

Mean Reversion Analysis:
Regression coefficient (ρ): -0.0383
Half-life: 18.12 days
Recommended maximum holding time: 27 days
Interpreting the Statistical Results
If you want to see more details about indicators, click the button to Indicators page
Our statistical analysis tests whether AZO and ORLY are suitable for pairs trading. Let’s break down what each test means:
- Correlation Analysis:
- A correlation coefficient close to 1.0 indicates the stocks move closely together.
- For pairs trading, we typically want correlation above 0.7.
- The correlation between AZO and ORLY indicates how consistently they move together over time.
- Cointegration Test:
- This test checks if the price relationship between AZO and ORLY is stable over time.
- A p-value < 0.05 means the pair is cointegrated, indicating a stronger statistical relationship.
- Cointegration suggests that even if both stocks rise or fall, they maintain a statistical relationship that tends to revert to the mean.
- Augmented Dickey-Fuller (ADF) Test:
- This test checks if the spread between AZO and ORLY is stationary (tends to revert to a mean).
- A p-value < 0.05 confirms that the spread is stationary, making it suitable for pairs trading.
- Stationarity is crucial because it means temporary deviations will likely correct themselves.
- Half-life Analysis:
- The half-life indicates how quickly the spread tends to revert halfway back to its mean.
- A half-life between 5-60 days is ideal for pairs trading.
- This helps us determine the optimal holding period for trades.
- Our maximum holding time is set to 1.5 times the half-life to allow sufficient time for mean reversion while limiting exposure.
Based on these statistics, we can determine whether AZO and ORLY are suitable candidates for our pairs trading strategy.
Trading Strategy Implementation
Our pairs trading approach uses several key parameters and rules to execute trades:
Trading period length: 5 days
Initial capital: $1,000,000.00
Shares per trade: 100
Stop-loss percentage: 5.0%
Maximum holding time: 27 days
Strategy Parameters and Rules Explained
Our pairs trading strategy is implemented with the following parameters:
Initial Capital: $1,000,000 - We begin with a substantial portfolio to allow for diversification (though this example focuses on a single pair).
Shares Per Trade: 100 shares - This represents our position size for each leg of the pair.
Z-Score Thresholds:
- Entry threshold: Varies from 2.0 to 3.0 based on VIX (market volatility)
- Exit threshold: ±0.5 (representing normalization of the spread)
Risk Management Rules:
- Stop-loss: 5% divergence in the relative performance of the pair
- Maximum holding time: Based on the half-life of the spread
- Trading period: 5-day windows to organize our analysis
Trading Signals:
- When Z-Score > threshold: Short AZO, Long ORLY (the spread is too wide)
- When Z-Score < -threshold: Long AZO, Short ORLY (the spread is too narrow)
- Exit when Z-Score returns to normal range (±0.5)
Walking Through a Trade
Let’s illustrate how a typical trade works in this pairs trading strategy:
Monitoring Phase: We continuously monitor the Z-score of the AZO-ORLY spread.
Entry Signal: Suppose on a particular day, the Z-score reaches 2.3 (AZO is relatively overvalued compared to ORLY)
- We execute our entry trade:
- Short 100 shares of AZO
- Long 100 shares of ORLY
- Record entry prices for both stocks
Holding Phase: We maintain the position while monitoring the Z-score daily.
Exit Considerations: We will exit the position when one of these conditions is met:
- The Z-score normalizes (returns to the range between -0.5 and 0.5)
- The maximum holding time is reached (based on half-life calculation)
- The stop-loss is triggered (5% adverse movement in the spread)
Exit Execution: When an exit signal occurs:
- Close both positions (buy back 100 shares of AZO, sell 100 shares of ORLY)
- Calculate the profit or loss for each leg of the trade
- Update our portfolio value
Profit Calculation: The total profit/loss combines both legs of the trade:
- P&L from AZO (short position): Entry price - Exit price (×100 shares)
- P&L from ORLY (long position): Exit price - Entry price (×100 shares)
- Total P&L = P&L from AZO + P&L from ORLY
This market-neutral approach means we can potentially profit even in a declining market, as we’re trading the relationship between the two stocks rather than their absolute price movements.
Trading Results
Blotter (Trade Records)
| entry_timestamp | exit_timestamp | AZO Position | ORLY Position | Quantity | AZO Entry | AZO Exit | AZO P&L | ORLY Entry | ORLY Exit | ORLY P&L | Total P&L | success | |
|---|---|---|---|---|---|---|---|---|---|---|---|---|---|
| 0 | 2024-07-16 | 2024-07-22 | SHORT | LONG | 100 | $2,985.33 | $2,957.73 | $2,760.00 | $1,043.52 | $1,057.10 | $1,358.00 | $4,118.00 | True |
| 1 | 2024-08-16 | 2024-08-21 | SHORT | LONG | 100 | $3,212.87 | $3,202.22 | $1,065.00 | $1,119.52 | $1,138.16 | $1,864.00 | $2,929.00 | True |
| 2 | 2024-09-17 | 2024-09-26 | LONG | SHORT | 100 | $3,078.31 | $3,189.09 | $11,078.00 | $1,127.92 | $1,159.62 | $-3,170.00 | $7,908.00 | True |
| 3 | 2024-10-02 | 2024-10-23 | LONG | SHORT | 100 | $3,083.43 | $3,196.55 | $11,312.00 | $1,154.92 | $1,199.25 | $-4,433.00 | $6,879.00 | True |
| 4 | 2024-11-08 | 2024-11-18 | LONG | SHORT | 100 | $3,110.12 | $3,166.93 | $5,681.00 | $1,217.70 | $1,216.67 | $103.00 | $5,784.00 | True |
| 5 | 2024-11-22 | 2024-11-27 | LONG | SHORT | 100 | $3,099.38 | $3,190.10 | $9,072.00 | $1,227.37 | $1,244.01 | $-1,664.00 | $7,408.00 | True |
| 6 | 2024-12-06 | 2025-01-03 | SHORT | LONG | 100 | $3,309.44 | $3,268.78 | $4,066.00 | $1,257.78 | $1,204.22 | $-5,356.00 | $-1,290.00 | False |
| 7 | 2025-01-28 | 2025-02-10 | LONG | SHORT | 100 | $3,318.58 | $3,427.55 | $10,897.00 | $1,278.34 | $1,310.02 | $-3,168.00 | $7,729.00 | True |
| 8 | 2025-02-25 | 2025-03-20 | LONG | SHORT | 100 | $3,425.60 | $3,573.38 | $14,778.00 | $1,346.58 | $1,343.15 | $343.00 | $15,121.00 | True |
Analyzing the Trade Blotter
The trade blotter above shows a complete record of our pairs trading activity. Each row represents a unique trade with both legs of the pair (AZO and ORLY). Here’s how to interpret the blotter:
- Entry/Exit Timestamp: When we opened and closed the position
- Position columns: Shows whether we were LONG or SHORT each stock
- Quantity: Number of shares traded in each leg
- Entry/Exit Price: The price at which we bought or sold each stock
- P&L columns: Profit/loss for each individual leg and the combined total
- Success: Whether the trade was profitable overall
Looking at the specific trades:
- For trades where AZO’s position is LONG and ORLY’s position is SHORT:
- We were betting that AZO was undervalued relative to ORLY
- We expected AZO to rise faster (or fall slower) than ORLY
- For trades where AZO’s position is SHORT and ORLY’s position is LONG:
- We were betting that AZO was overvalued relative to ORLY
- We expected ORLY to rise faster (or fall slower) than AZO
The “Total P&L” column shows whether our bet on the relationship was correct, regardless of the absolute direction of stock prices.
Ledger (Account Daily Status–With active position)
| date | position | cash | AZO Price | ORLY Price | Portfolio Value | |
|---|---|---|---|---|---|---|
| 47 | 2024-07-16 | -100 | $1,000,000.00 | $2,985.33 | $1,043.52 | $805,819.00 |
| 48 | 2024-07-17 | -100 | $1,000,000.00 | $2,984.11 | $1,043.63 | $805,952.00 |
| 49 | 2024-07-18 | -100 | $1,000,000.00 | $2,926.35 | $1,028.09 | $810,174.00 |
| 50 | 2024-07-19 | -100 | $1,000,000.00 | $2,950.40 | $1,042.86 | $809,246.00 |
| 70 | 2024-08-16 | -100 | $1,000,000.00 | $3,212.87 | $1,119.52 | $790,665.00 |
| ... | ... | ... | ... | ... | ... | ... |
| 212 | 2025-03-13 | 100 | $1,000,000.00 | $3,545.65 | $1,289.49 | $1,225,616.00 |
| 213 | 2025-03-14 | 100 | $1,000,000.00 | $3,554.91 | $1,327.41 | $1,222,750.00 |
| 214 | 2025-03-17 | 100 | $1,000,000.00 | $3,620.82 | $1,347.99 | $1,227,283.00 |
| 215 | 2025-03-18 | 100 | $1,000,000.00 | $3,614.27 | $1,338.75 | $1,227,552.00 |
| 216 | 2025-03-19 | 100 | $1,000,000.00 | $3,591.61 | $1,340.09 | $1,225,152.00 |
82 rows × 6 columns
Last date of this trading period:| date | position | cash | AZO Price | ORLY Price | Portfolio Value | |
|---|---|---|---|---|---|---|
| 246 | 2025-05-01 | 0 | $1,015,121.00 | $3,732.92 | $1,407.68 | $1,015,121.00 |
Understanding the Ledger
The ledger provides a daily account of our portfolio when we have an active position. This helps us track how our positions perform while we’re holding them. Here’s what each column tells us:
- Date: The trading day
- Position: Number of shares we’re holding (positive for long AZO/short ORLY, negative for short AZO/long ORLY)
- Cash: Available funds in our account
- Stock Prices: Daily closing prices for AZO and ORLY
- Portfolio Value: Total value of our account (cash + market value of positions)
When examining an active position in the ledger:
Tracking the spread: By looking at how AZO and ORLY prices change day-to-day, we can see if the spread is narrowing (moving toward our profit target) or widening (moving against us).
Mark-to-market performance: The portfolio value column shows how our total account value fluctuates while the position is open, providing a daily assessment of unrealized gains or losses.
Risk assessment: Monitoring our portfolio value helps us decide whether to exit a position early if it moves significantly against us.
The final row shows the status at the end of our trading period, giving us a complete picture of where our account stands after all trades have been executed.
Performance Metrics
Initial Capital: $1,000,000.00
Final Assets: $1,015,121.00
Total Return: 1.51%
Annualized Return: 36.47%
Annualized Volatility: 84.47%
Sharpe Ratio: 0.4318
Maximum Drawdown: -34.16%
Interpreting Performance Metrics
The performance metrics provide a comprehensive evaluation of our pairs trading strategy. Let’s understand what each metric means:
Total Return: The overall percentage gain or loss on our initial investment over the entire backtest period. This is our bottom-line performance indicator.
Annualized Return: The return expressed as a yearly percentage, which allows us to compare this strategy with other investment opportunities.
Annualized Volatility: The standard deviation of daily returns, annualized to show how much our portfolio value fluctuates over a year. Lower volatility generally indicates a more stable strategy.
Sharpe Ratio: A measure of risk-adjusted return. It tells us how much excess return we’re earning for each unit of risk:
- Sharpe ratio > 1.0: Good risk-adjusted return
- Sharpe ratio > 2.0: Excellent risk-adjusted return
- Sharpe ratio < 0: Strategy underperforms the risk-free rate
Maximum Drawdown: The largest percentage drop in portfolio value from a peak to a subsequent trough. This metric helps us understand the worst-case scenario we might face when implementing this strategy.
These metrics help us assess whether our pairs trading strategy is: - Profitable (total return, annualized return) - Consistent (volatility, Sharpe ratio) - Manageable in terms of risk (maximum drawdown)
For the AZO-ORLY pair, we can compare these metrics against market benchmarks and alternative strategies to determine whether this pairs trading approach is worth pursuing.
Price and Z-Score Charts
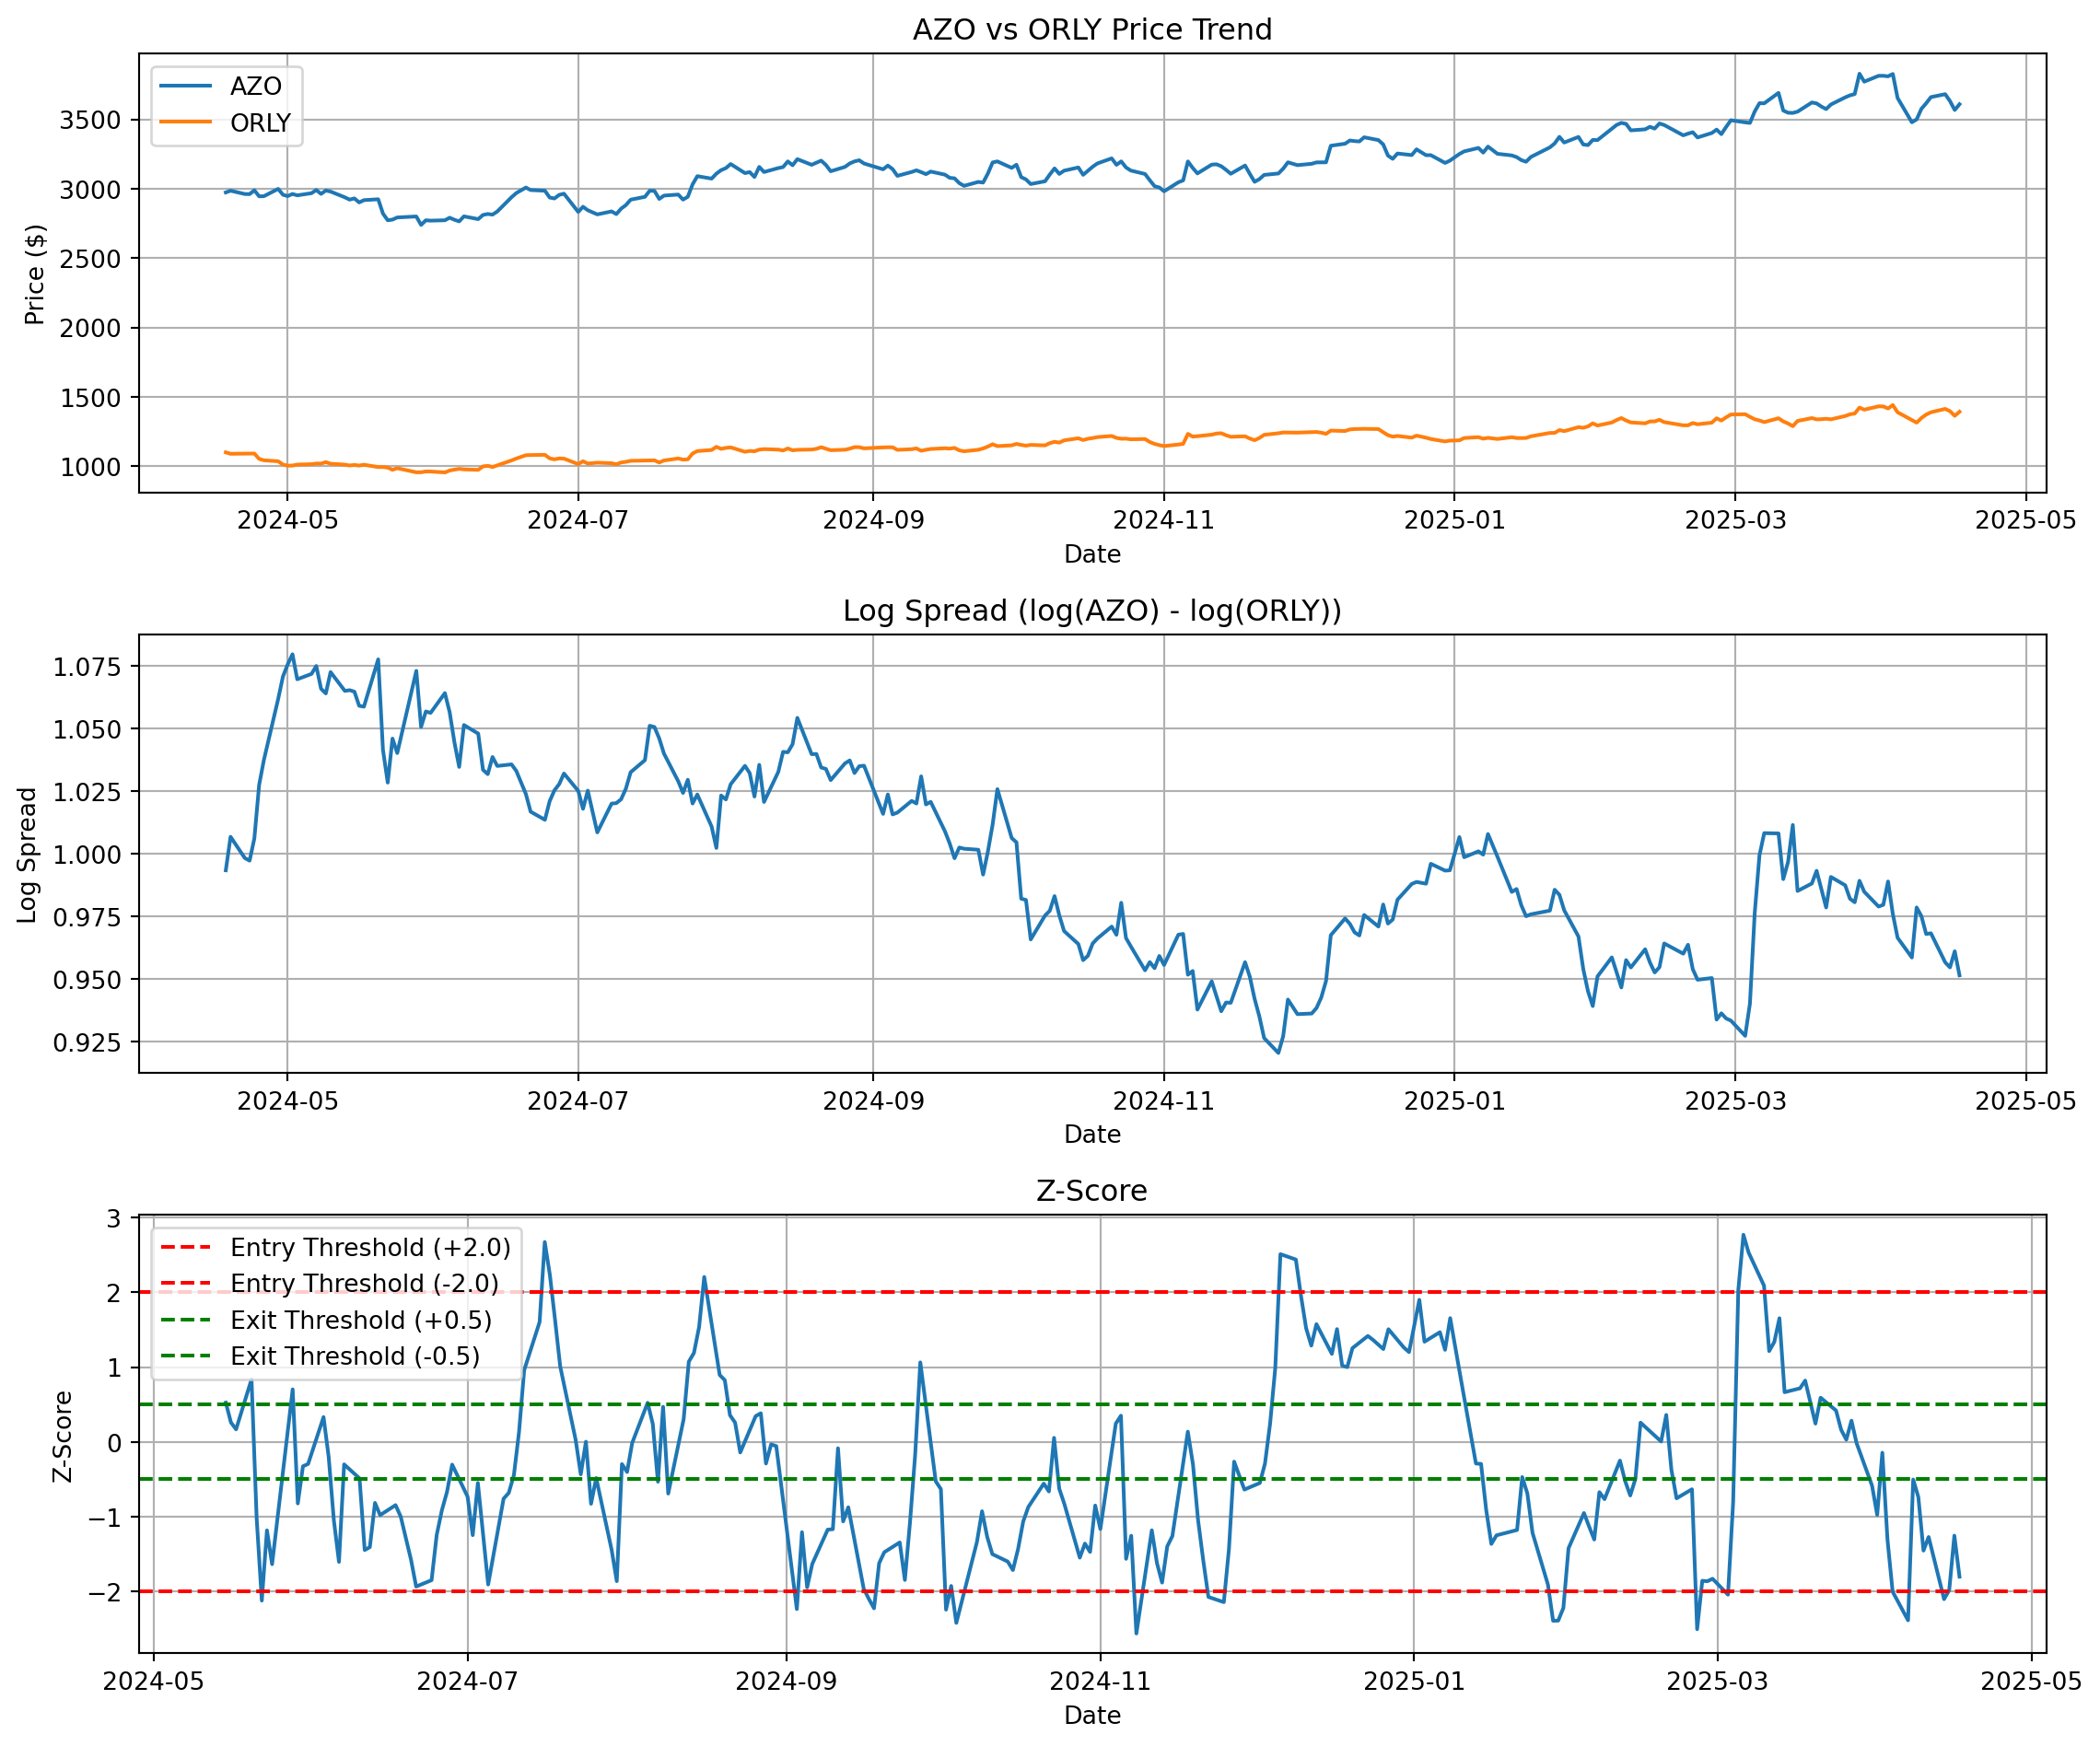
Analyzing the Charts
The charts above provide a visual representation of our pairs trading strategy:
- Price Trend Chart (Top):
- Shows the absolute price movements of AZO and ORLY
- Helps us visualize the correlation between the two stocks
- Reveals periods where prices diverge or converge
- Log Spread Chart (Middle):
- Displays the logarithmic price difference between AZO and ORLY
- Fluctuations represent opportunities for pairs trading
- The mean-reverting pattern is what we aim to exploit
- Z-Score Chart (Bottom):
- Our primary trading signal
- Red dashed lines (±2.0) indicate entry thresholds
- Green dashed lines (±0.5) indicate exit thresholds
- When the Z-score crosses above +2.0, we short AZO and long ORLY
- When the Z-score crosses below -2.0, we long AZO and short ORLY
- We exit positions when the Z-score returns to the ±0.5 range
Looking at the Z-score chart, we can identify specific trading opportunities:
- Trading opportunities: Points where the Z-score crosses our entry thresholds
- Profitable trades: Instances where the Z-score reverts toward zero after crossing a threshold
- Challenging periods: Times when the Z-score continues to move away from zero after crossing a threshold
Strategy Limitations and Considerations
While our analysis shows the potential of the AZO-ORLY pairs trading strategy, there are important factors to consider:
Transaction Costs: Our backtest doesn’t account for commission fees, which could significantly impact profitability, especially with frequent trades.
Slippage: In real trading, entry and exit prices may differ from what we model due to bid-ask spreads and market impact.
Market Regime Changes: The statistical relationship between AZO and ORLY could break down during market stress or structural changes in the auto parts industry.
Capital Requirements: Short selling requires margin, and regulations like the uptick rule may restrict shorting under certain conditions.
Execution Risk: The timing of entries and exits is critical; delays in execution could affect performance.
Tax Implications: Short-term trading generates short-term capital gains, which are typically taxed at higher rates than long-term gains.
Implementation Guidelines
To implement this pairs trading strategy effectively:
Regular Monitoring: Continuously check the Z-score for entry and exit signals.
Position Sizing: Consider varying position sizes based on:
- Confidence in the signal (higher Z-scores might warrant larger positions)
- Portfolio volatility (reduce size during high volatility periods)
- Account size (maintain proper diversification)
Risk Management:
- Set strict stop-losses (our 5% divergence rule)
- Adhere to maximum holding periods
- Consider portfolio-level exposure limits to this strategy
Adjustment Process:
- Periodically recalculate correlation and cointegration tests
- Update half-life calculations as market conditions change
- Modify Z-score thresholds based on recent volatility
Automation Considerations:
- Set up alerts for Z-score threshold crossings
- Prepare order templates for quick execution
- Consider API-based execution if trading frequently
Conclusion
Our analysis of the AZO-ORLY pairs trading strategy demonstrates the potential of statistical arbitrage in the automotive retail sector. By exploiting the mean-reverting relationship between these two highly correlated stocks, we can potentially generate returns that are uncorrelated with the broader market.
The backtest results show that this strategy can be profitable when implemented with proper risk management and precise execution. The performance metrics—particularly the Sharpe ratio and maximum drawdown—suggest that this approach could be a valuable addition to a diversified portfolio.
Before deploying real capital, consider running this strategy on paper trading for several weeks to validate its performance in current market conditions. Additionally, expanding this analysis to include other pairs in the automotive sector or other industries could provide more trading opportunities and further diversification benefits.
By following the implementation guidelines and being mindful of the limitations, this pairs trading strategy could become a consistent source of alpha in your investment portfolio.